|
|
| Home | History / Background | Building the Observatory | Research | Photo Album | Who Am I? |
|
Transforming to a Standard Photometric System
(16 July 2011)
When performing any photometric measurement of stars, best results cannot be gotten unless
the collected data are transformed from the observed, instrumental measures to a standard photometric
scale, or system. Putting one's observed data onto a standard, calibrated measurement scale means that
valid comparisons of data captured over long periods of time by numerous observers, and obtained with telescope systems that may
have vastly different characteristics and configurations, can be accurately aggregated and compared.
How a telescope system (camera plus filter plus telescope) responds to the influx of light from distant stars depends on many factors, including the telescope, the filters used, the camera's CCD sensitivity, atmospheric extinction properties influenced by moisture, dust and scattered light, and the astrophysical properties of the stars being observed: spectral type (i.e. surface temperature) in particular. Transformation equations are applied to remove most of these effects, which then permit comparing/aggregating multi-color photometry from many observers over long periods of time, as mentioned above. |
|
The examples here cut straight to the chase. There are several good papers and books
about the derivation of tranformation equations.
Here is one transformation recipe,
written by Bruce Gary, that develops those transformations mathematically for telescope systems with
Johnson B,V,R,I filters. The first twelve pages of this paper carry on a understandable
discussion about the effects of filters, CCDs and the atmosphere, and why it is necessary to account for
those effects. The remainder presents the steps in developing transformation equations themselves. The formulas
are general enough to apply to filters with other bandpasses.
Generally speaking, since we're dealing with CCD photometry, we're talking about taking an image of some duration (in my case 50 seconds each) at one place in the sky. Because we have a digital photograph of a small field of view, each star in the image is affected the same way by the atmosphere, the telescope, the filter and the camera chip. A lot of simplifications for transformation can be made for this situation. |
|
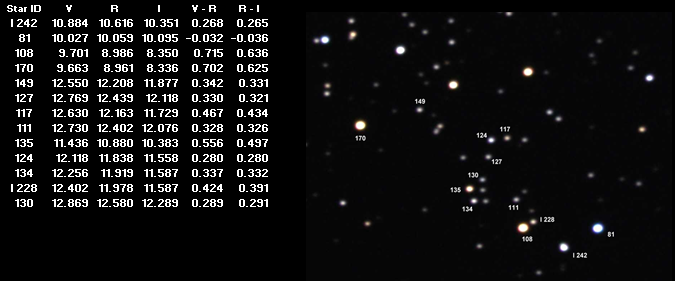
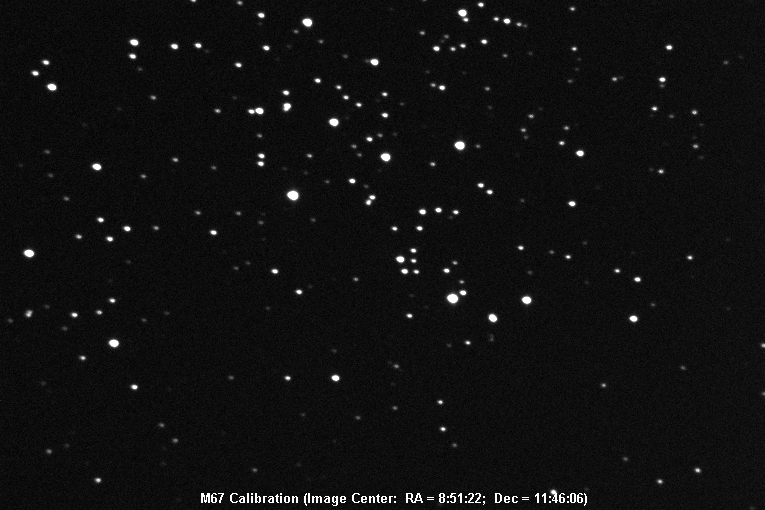
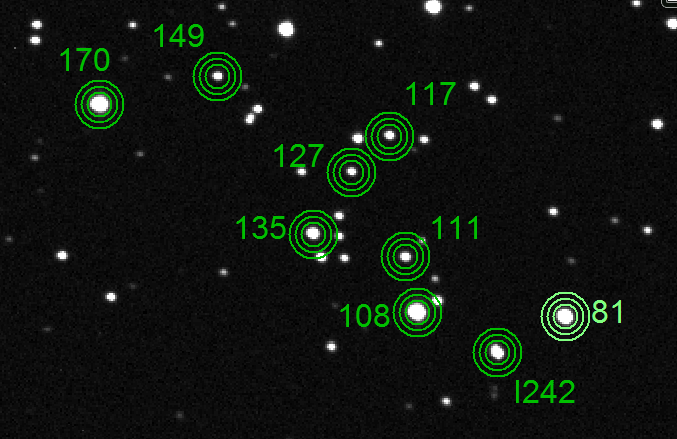
The Calibrated Field of M67
To generate the transformation equations, it's customary to take images of star fields for which "standard system" magnitudes are already known. A typical approach is to image star clusters. It doesn't matter whether the cluster is nearby or more distant. What matters is that accurate standard BVRI magnitudes have been determined for a number of non-variable stars in the cluster. M67 is one of those clusters that has been observed over and over again, and has a large collection of stars for which standard magnitudes have been determined. Here's an image of M67, from Gary's paper, identifying thirteen standards and their standard apparent magnitudes and colors.
|
|
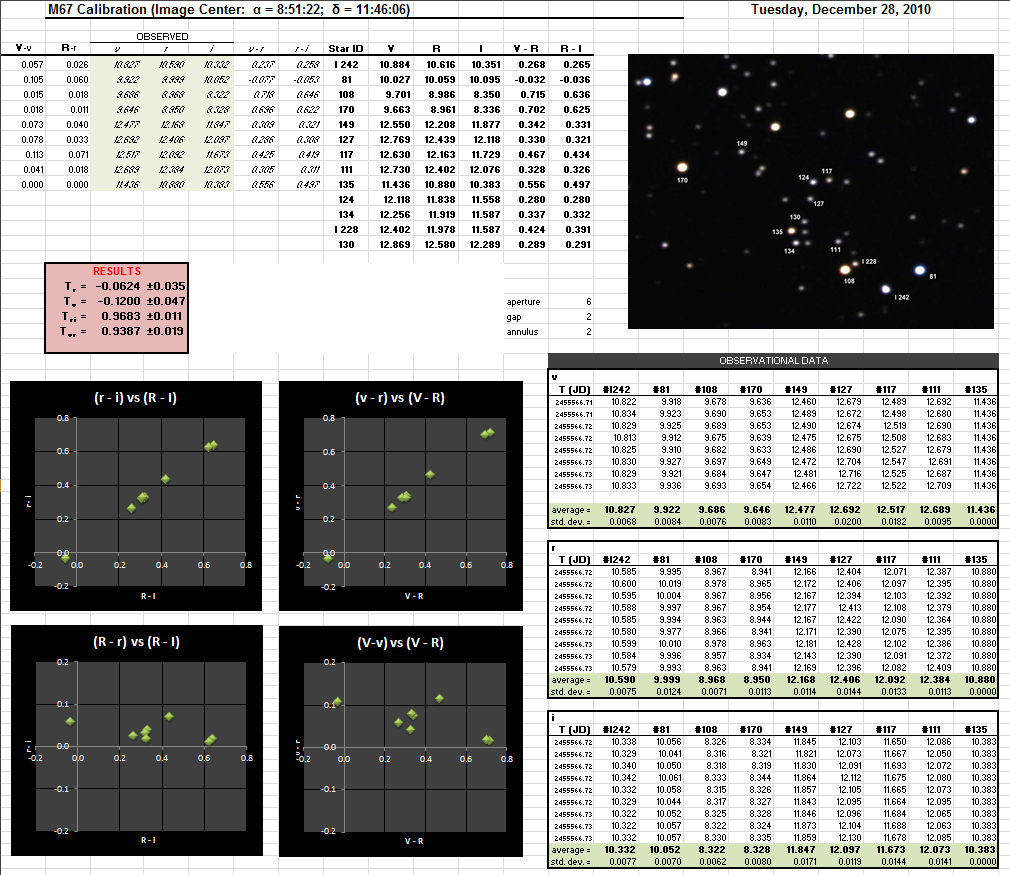
Data Collection
This spreadsheet contains the tabulated data from measuring twenty-seven images (9 V, 9 R, and 9 I). The images were taken on a very clear and steady December 28, 2010, three at a time and cycling three times over, over the course of twenty-one minutes. One of the V images was trailed and discarded, leaving 28 images altogether.
[more to follow..] |
![]()