|
|
| Home | History / Background | Building the Observatory | Research | Photo Album | Who Am I? |
|
IP Pegasi
(26 Sep 2009) |
|
The remarkable U Gem-type dwarf nova, IP Pegasi, is an eclipsing binary system with an
orbital period (of 3.80 hours = 228 minutes) that shows evidence of spiral arms in its
accretion disc. IP Peg is one of the few eclipsing dwarf novae for which the inclination of the orbital
plane is large enough for the companion star to eclipse the white dwarf primary, the
accretion disc, and the hot spot (the place where the gas stream hits the outer of
edge of the accretion disc). By studying these deep eclipses, information about
accretion disc evolution and outburst mechanisms in dwarf novae are discovered.
This binary is a well-studied one, with numerous references in the literature. The time of
primary minimum is predicted by the equation:
HJD = 2452500.071500 + 0.15820606 x CycleNo. |
|
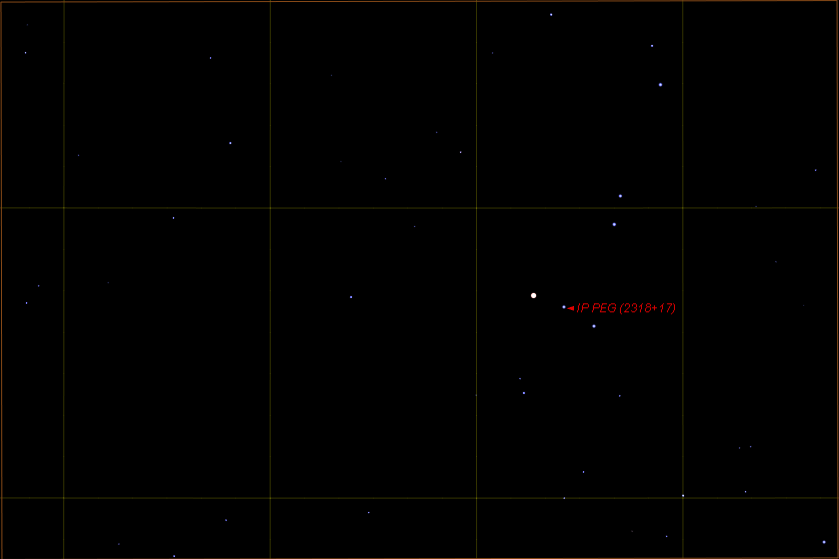
Finding chart for IP Pegasi
IP Peg: RA(2000) = 23h 23m 08.6s Dec(2000) = 18° 24' 59.3"
|
|
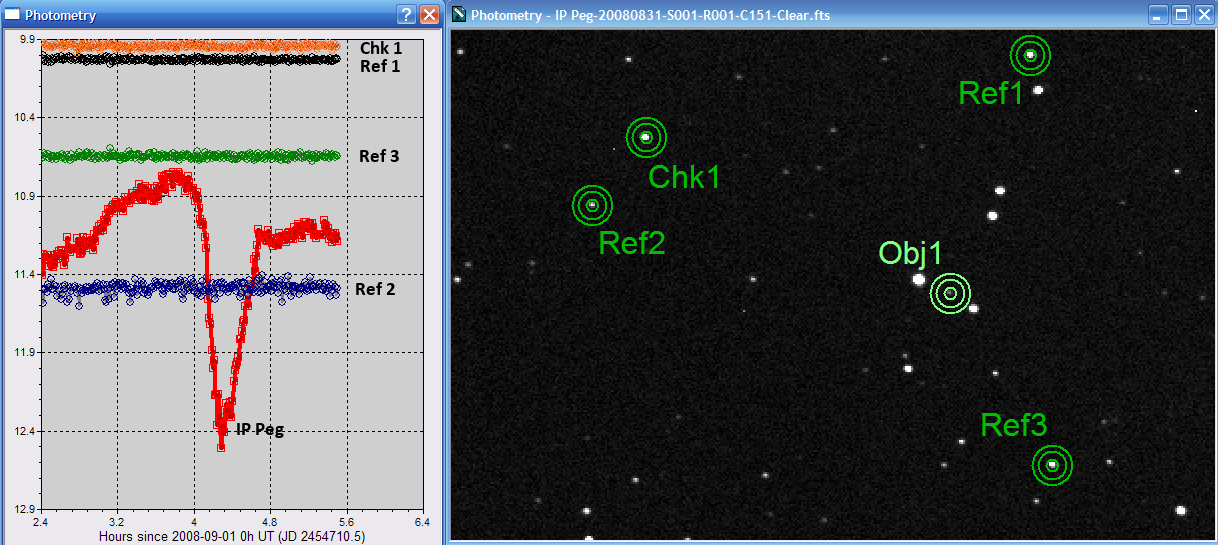
Eclipse curves for IP Pegasi
Observation of IP Pegasi was carried out on several nights for a period of about three to four hours. One night's observation was done over a year ago. Each data point represents a 50-second integration exposure using an ST-7XME CCD camera cooled to -30°C and a "Clear" filter. Each point is separated by about one minute. The telescope is continuously autoguided. After observing, all of the CCD images in the series are calibrated in the standard way to remove dust donuts and vignetting. The figure below shows the eclipse curve for IP Pegasi, along with three reference stars. This is data from 31-Aug/01-Sep 2008 EST (cycle no. 13973), and the observed geocentric time of minimum (midpoint of the eclipse "well") was approximately 01 Sep 2008 04:17:48 UT, or HJD = 2454710.68411. The image on the right is a single CCD frame near the time of mid-eclipse, #151 from a series of 249 images. The positions of IP Pegasi and the reference stars are indicated in the image and on the graphic.
|
|
Things to Note
These are preliminary results, based only on inspection of the light curves and
corresponding CCD images. The equations used to generate heliocentric predictions for primary
minimum were corrected to get a geocentric UT time for the predicted minima. The observed geocentric
UT time of primary minimum is determined from the light curve, and corrected again to determine
the observed heliocentric Julian date of mid-eclipse.
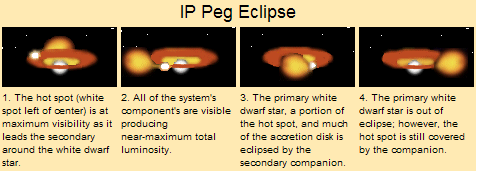
The magnitudes shown on the graphics are instrumental magnitudes, and they have not been transformed to a standard photometric system. Nevertheless, the "constant" values for the magnitudes of the reference and check stars demonstrate that the telescope-CCD system and evening conditions were stable. "The light curve of IP Peg displays both the eclipsing variability of the system, which occurs every 3.8 hours, and the dwarf novae outbursts, which have amplitudes of about 2 magnitudes and recur roughly every 3 months. These "inside-out" type dwarf nova outbursts of IP Peg are discussed below. The eclipsing variability of IP Peg is shown above in figure 1. It is characterized by a large orbital hump which is due to the maximum visibility of the hot spot and other visual components of the system. Then the hot spot and the white dwarf enter eclipse and the light curve declines. The white dwarf and the hot spot enter eclipse simultaneously, making the individual components indistinguishable on the light curve. The white dwarf exits the eclipse before the hot spot, but the hot spot makes a more profound emergence because it is considerably brighter than the white dwarf. A model of an IP Peg eclipse is shown below." (Courtesy of AAVSO, which has a very detailed discussion of this interesting eclipsing system.)
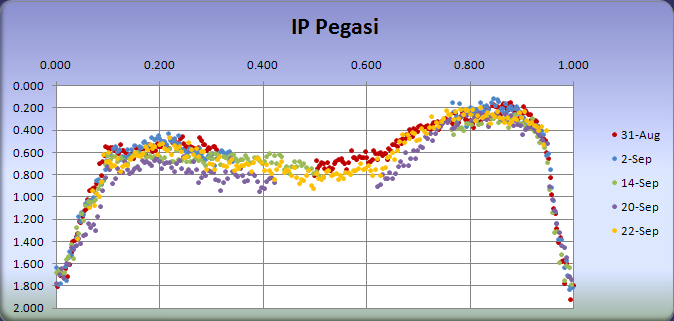
All available data are shown in the figure below. It's clear from my observations that there is a great deal of excursion in the amplitude of the variations. I chose to line up the primary eclipse depths, since that represents the eclipse of the hot spot and the accretion disk (stage 3 in the diagram above).
|
|
References
|
|
|
|
This data and information on this page are Copyright © 2008-2009, Richard A. Berg, Washington, DC
|